Customer's question: “I want to calculate a streak. Or consecutive days up or down.”
example
day 1 = up (from day 0) = 1
day 2 = up (from day 1) = 2
day 3 = up (from day 2) = 3
day 4 = down =(-1)
day 5 = down =(-2)
day 6 = up = 1
etc.
OK. Let's try it. Use this code and run Exploration.
// Use just MSFT and restrict bars for this example.
// We will get a huge Exploration data otherwise.
SetOption("Symbols","MSFT");
SetOption("ApplyFromTime", "2015-03-10");
// All bars in Exploration
Filter = TRUE;
// dayUp = today's Close is greater than yesterday's Close
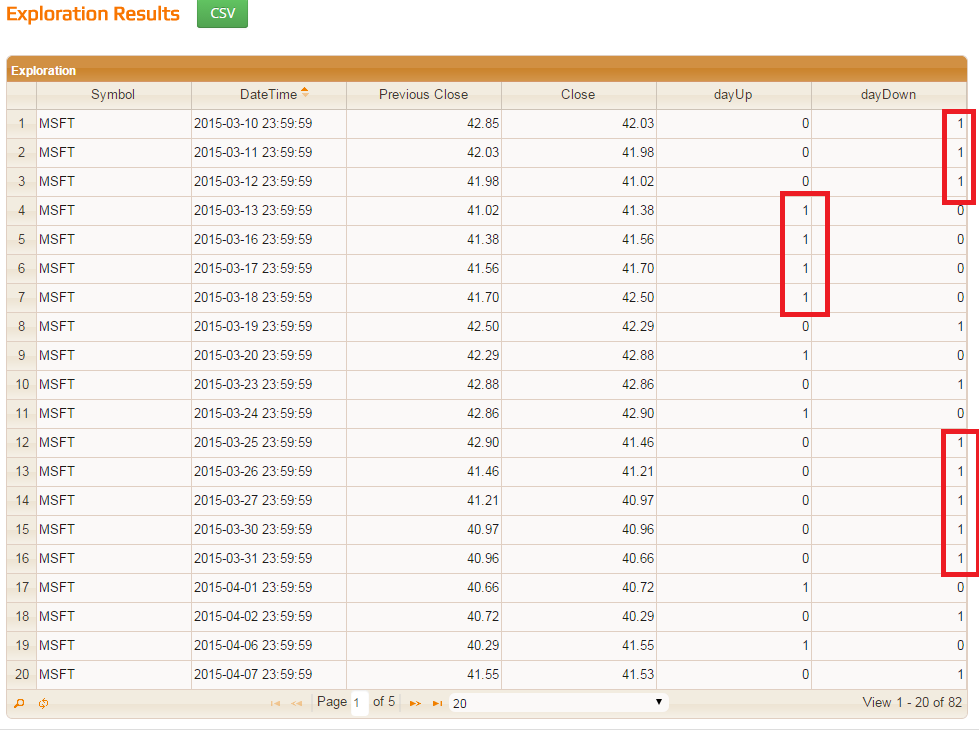
dayUp = Close > Ref(Close,-1);
// dayDown = today's Close is lesser than yesterday's
dayDown = Close < Ref(Close,-1);
// How it all looks in Exploration like:
appendColumn(Ref(Close,-1),"Previous Close");
appendColumn(Close,"Close");
appendColumn(dayUp,"dayUp",format=1.0);
appendColumn(dayDown,"dayDown",format=1.0);
OK. So it looks like we need to count those consecutive 1s somehow. A streak starts when a sequence of dayUp (dayDown) goes to one. So we need to count just from those moments. Is there any function which can detect those changes? We have Cross, ValueWhen and perhaps (not yet implemented) FlipFlop. But it seems that the best is “BarsSince” in this case. It counts bars from the last TRUE.
Let's try it for “dayUp”. Comment out the “dayDown” column, add a BarsSince stuff and run Exploration:
// Use just MSFT and restrict bars for this example.
// We will get a huge Exploration data otherwise.
SetOption("Symbols","MSFT");
SetOption("ApplyFromTime", "2015-03-10");

// All bars in Exploration
Filter = TRUE;

// dayUp = today's Close is greater than yesterday's Close
dayUp = Close > Ref(Close,-1);

// dayDown = today's Close is lesser than yesterday's
dayDown = Close < Ref(Close,-1);

// How it all looks in Exploration like:
appendColumn(Ref(Close,-1),"Previous Close");
appendColumn(Close,"Close");
appendColumn(dayUp,"dayUp",format=1.0);
// appendColumn(dayDown,"dayDown",format=1.0);


streakUp = BarsSince(dayUp);
appendColumn(streakUp,"streakUp",format=1.0);
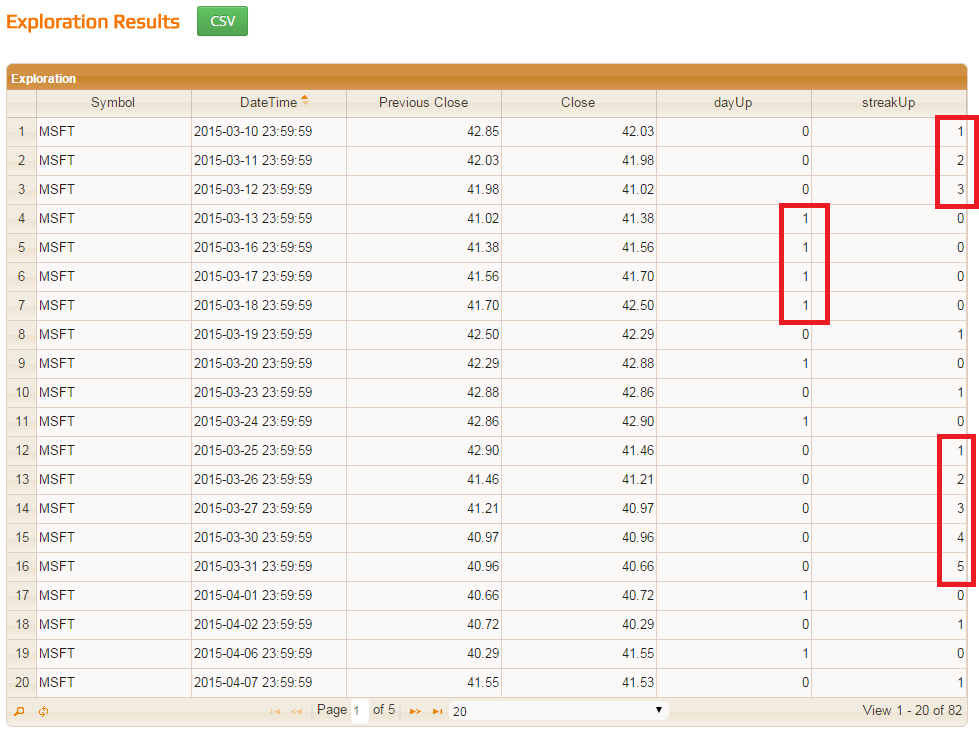
Huh! It does not count where our “dayUp” is TRUE! Contrary, it seems it works where it is FALSE - it means “dayDown”!
Well, let's read a description again: BarsSince calculates the number of bars (time periods) that have passed since ARRAY was true (or 1)
Aha! If we have two consecutive ones then a number of bars passed “since ARRAY was true (or 1)” is zero!
So it looks like we need to swap our values for BarsSince. We need 1s where we have 0s and vice versa. Both “dayUp” and “dayDown” will work then. Try the following code:
// Use just MSFT and restrict bars for this example.
// We will get a huge Exploration data otherwise.
SetOption("Symbols","MSFT");
SetOption("ApplyFromTime", "2015-03-10");
// All bars in Exploration
Filter = TRUE;
// dayUp = today's Close is greater than yesterday's Close
dayUp = Close > Ref(Close,-1);
// dayDown = today's Close is lesser than yesterday's
dayDown = Close < Ref(Close,-1);
// How it all looks like in Exploration:
appendColumn(Ref(Close,-1),"Previous Close");
appendColumn(Close,"Close");
// appendColumn(dayUp,"dayUp",format=1.0);
// appendColumn(dayDown,"dayDown",format=1.0);
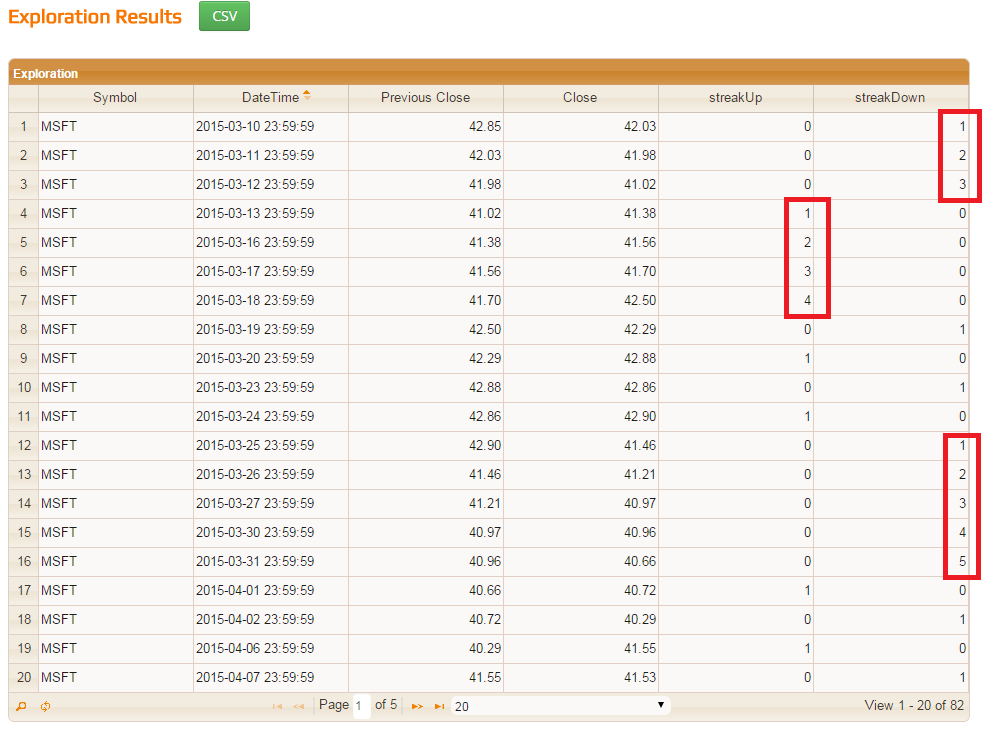
streakUp = BarsSince(NOT dayUp);
streakDown = BarsSince(NOT dayDown);
appendColumn(streakUp,"streakUp",format=1.0);
appendColumn(streakDown,"streakDown",format=1.0);
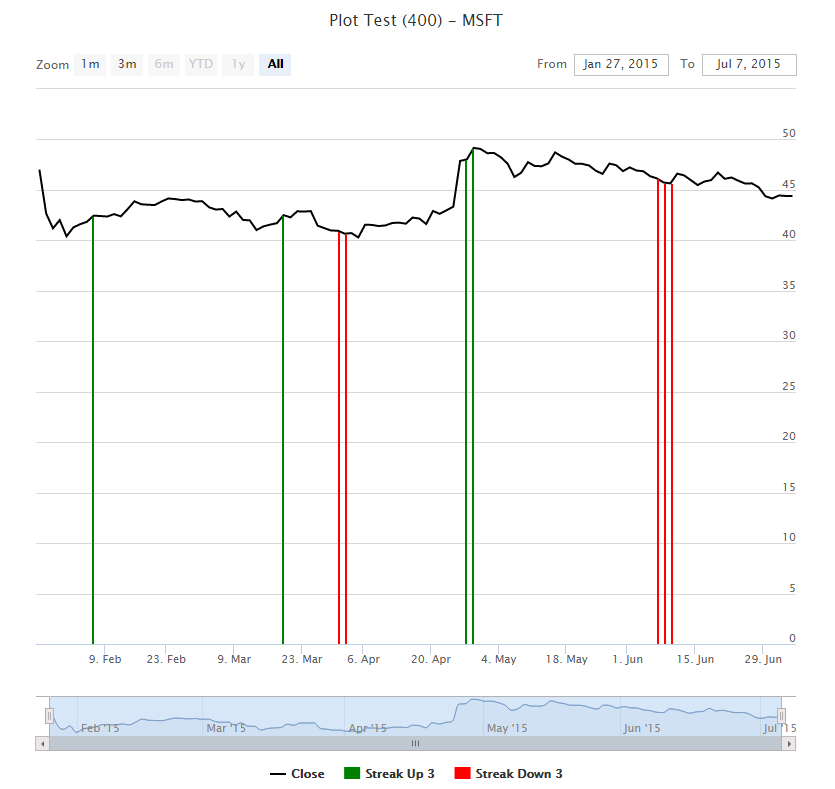
// See streaks longer than 3 days on charts
doPlot(Close,"Close",colorBlack,styleLine );
doPlot(Close * (streakUp > 3),"Streak Up 3",colorGreen,styleHistogram );
doPlot(Close * (streakDown > 3),"Streak Down 3",colorRed,styleHistogram );