| Timeseries Chart |
A timeseries chart for time based data.
The timeseries chart is used in some predefined charts (like a trading system equity chart) or it can be used with your own data. See examples.
This topic contains the following sections:
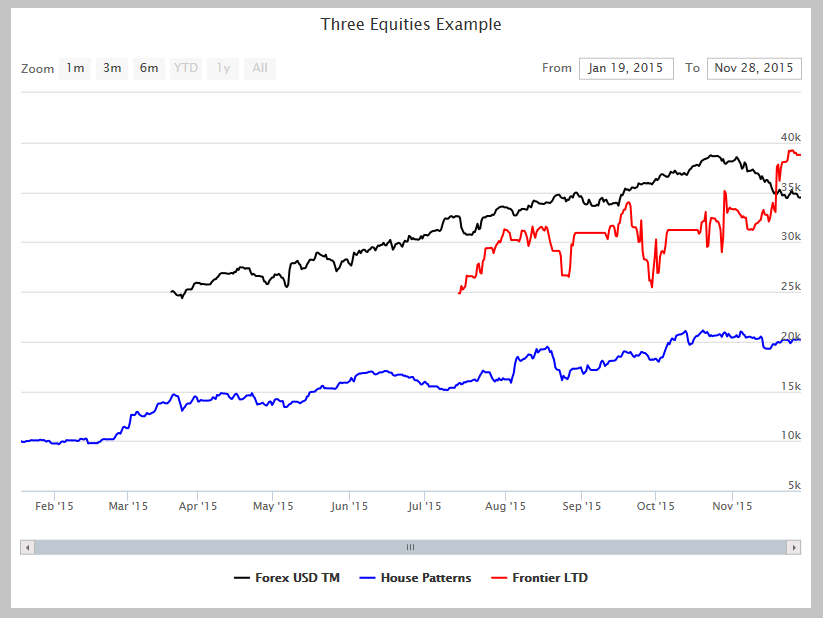
Can we see several trading systems equities in the same chart? Yes!
Timeseries chart
// Show equities of three trading systems

Int64[] systemsIds = { 93394264, 91958605, 95883303 };

ITimeSeriesChart commonChart = new TimeSeriesChart();
commonChart.Name = "Three Equities Example";
commonChart.Add(GetEquities(systemsIds));
CHART = commonChart;
Result

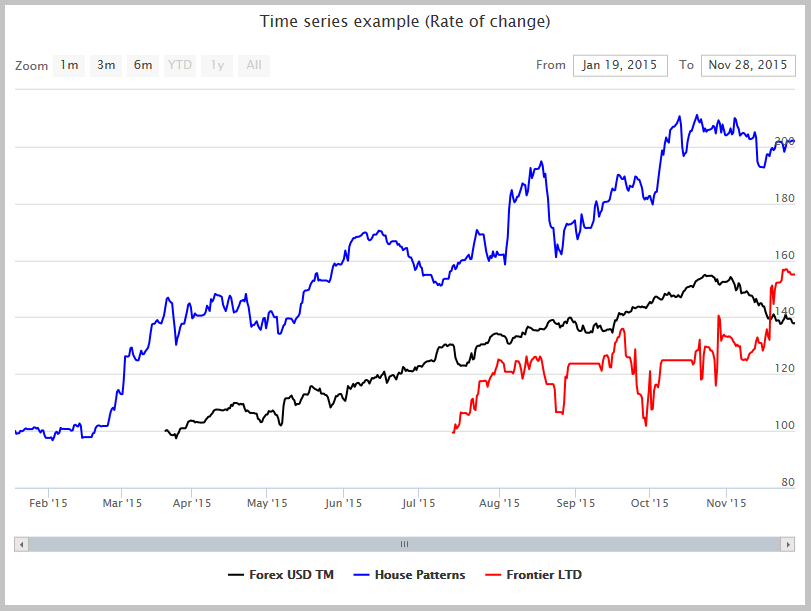
Good. But I want to compare their performances. Can I see their rate-of-change?
Timeseries chart
// Systems we want to see in the chart
Tuple<int, String, Color>[] systemsIds = { Tuple.Create(93394264, "Forex USD TM", Color.Blue),
                                           Tuple.Create(91958605, "House Patterns", Color.Red),
                                           Tuple.Create(95883303, "Frontier LTD", Color.Green)};

// Create a chart object
ITimeSeriesChart timeSeriesChart = new TimeSeriesChart();
timeSeriesChart.Name = "Time series example (Rate of change)";

// Add systems items to the chart
foreach (var id in systemsIds)
{
    IChartTimeSeries chartSeries = new ChartTimeSeries();
    chartSeries.Type = ChartTypes.Line;

    // Get starting capital
    Decimal startingCash = (from s in C2SYSTEMS
                            where s.SystemId == id.Item1
                            select s.StartingCash).First();

    // ROC as a collection of TimeSeriesPoint
    chartSeries.Data = from eq in C2EQUITY
                       where eq.SystemId == id.Item1
                       select new TimeSeriesPoint()
                       {
                           DateTime = eq.DateTime,
                           Value = 100 * (Double)(eq.Value / startingCash)
                       };

    chartSeries.Name = id.Item2;
    chartSeries.Color = id.Item3;

    timeSeriesChart.Add(chartSeries);
}

CHART = timeSeriesChart;
Result
