| TABLE |
This topic contains the following sections:
TABLE is a variable which accepts a list of objects. It shows a row for each object in the list. Properties of objects are shown as columns.
TABLE is rendered using a grid widget. It has sorting, filtering, grouping and other features.
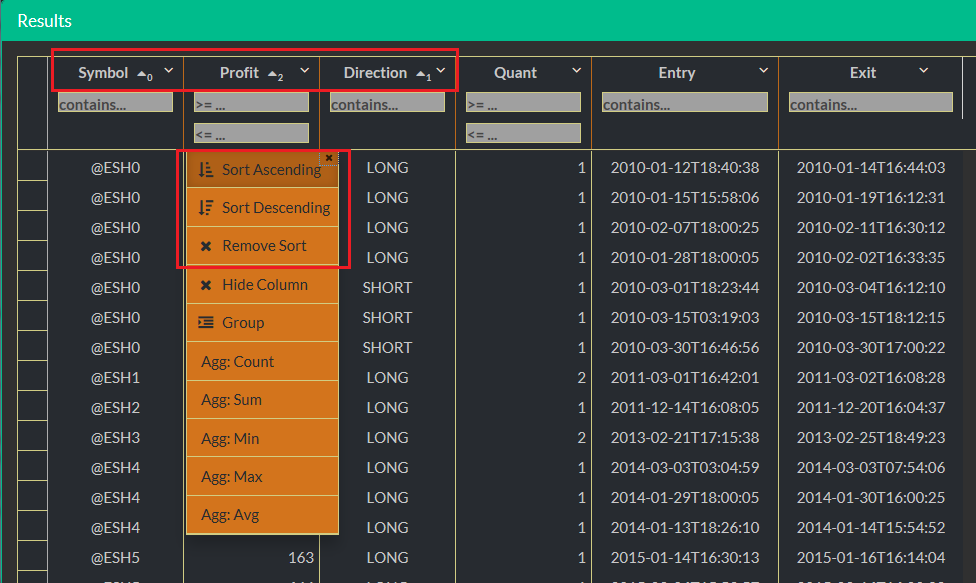
Sorting is probably the most used action. Just click on the column header to sort data up. Next click will sort data down and next click will remove sorting.
Multiple columns can be sorted by shift-clicking on the 2-n columns or selecting Sort from the menu.
When sorting using the menus, the sorts are additive. So if you have one column sorted and you pick another sort from a column menu, it will add on to the existing sort rather than replacing it. You need to use the 'remove sort' option on the existing column if you don't want to sort by it any more.
When sorting using the headers, clicking on a header removes all other sorts unless you shift-click.
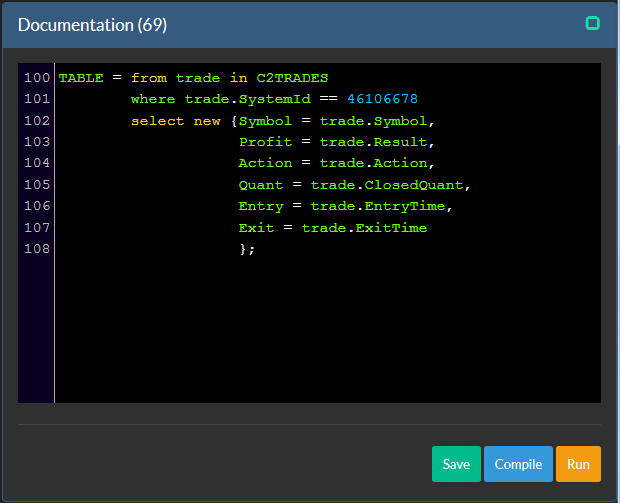
Try the following code:
TABLE = from trade in C2TRADES
        where trade.SystemId == 46106678
          select new {Symbol = trade.Symbol,
                    Profit = trade.Result,
                    Direction = trade.Action == "BTO" ? "LONG" : "SHORT",
                    Quant = trade.ClosedQuant,
                    Entry = trade.EntryTime,
                    Exit = trade.ExitTime
                    };
Select Sort in columns: Symbol, Direction and Profit then:
A data in the grid can be filtered.
Try the following code:
TABLE = from trade in C2TRADES
        where trade.SystemId == 46106678
          select new {Symbol = trade.Symbol,
                    Profit = trade.Result,
                    Direction = trade.Action == "BTO" ? "LONG" : "SHORT",
                    Quant = trade.ClosedQuant,
                    Entry = trade.EntryTime,
                    Exit = trade.ExitTime
                    };
Numerical fields have two entry fields for filters. The first filed uses the greater or equal than
expression,
the second filter uses the less or equal than
expression
Textual columns have one filed. It uses the contains
expression.
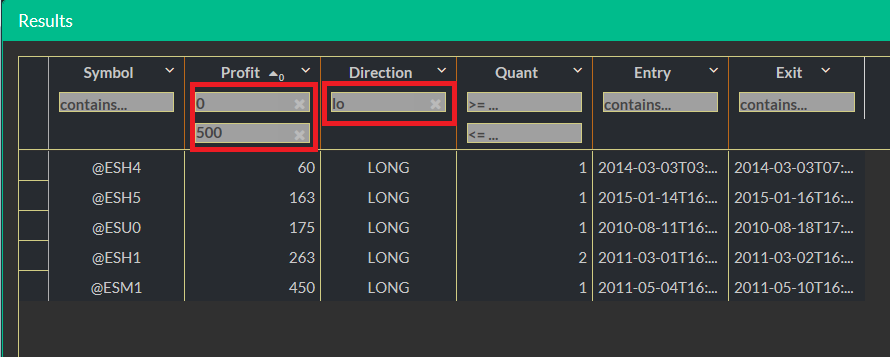
Example: Enter zero to the first field in the Profit
column, enter 500 to the second field and the text lo
to the field in the Direction
column.
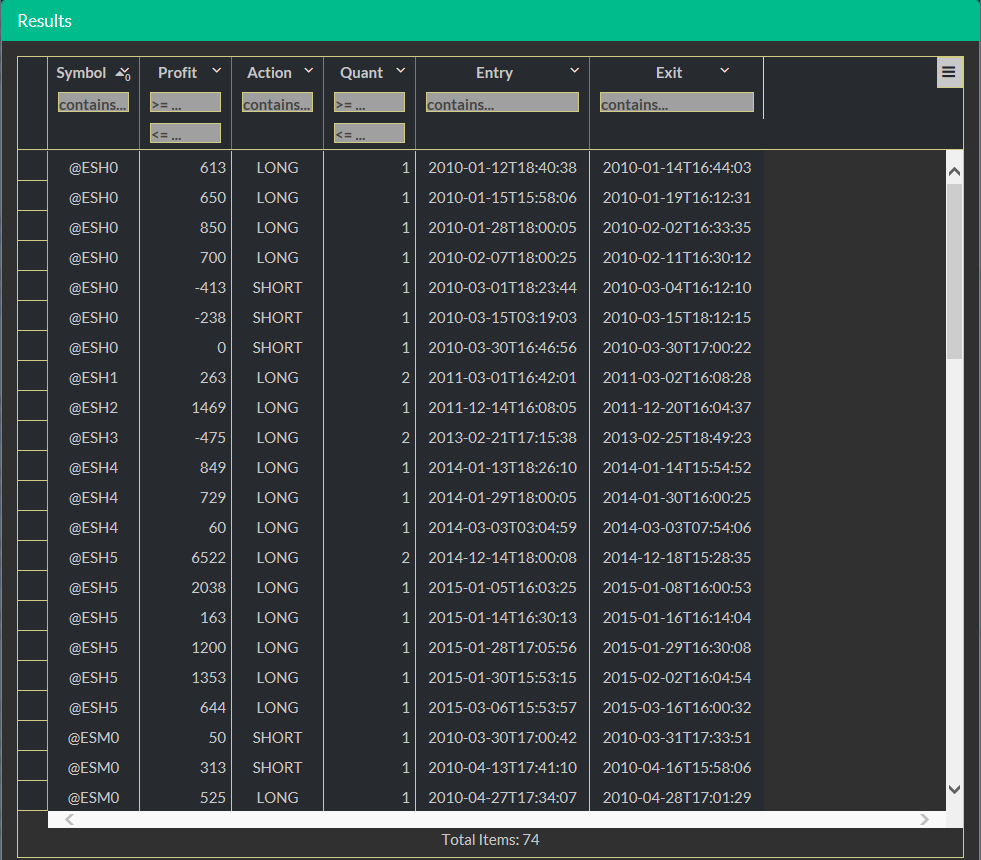
You will see only LONG profitable trades having profits less or equal to 500:
We want to see trading results per symbol.
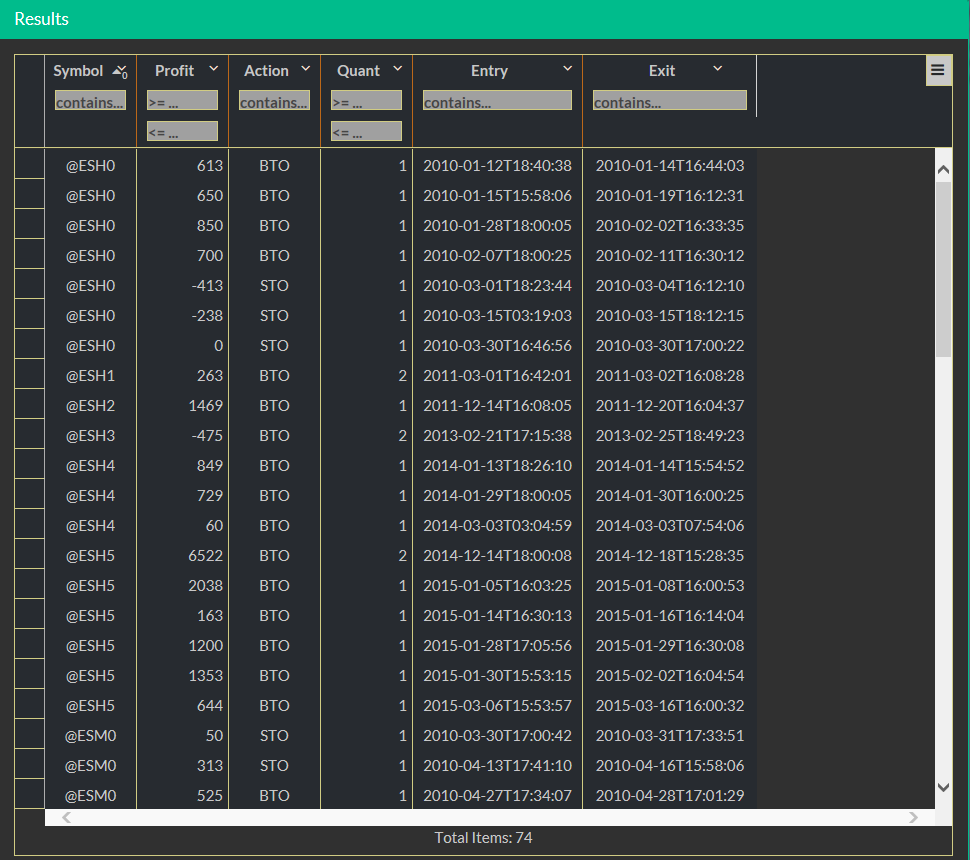
We will use a data produced by the following code. It selects trades of some trading system. Run it.
TABLE = from trade in C2TRADES
        where trade.SystemId == 46106678
        select new {Symbol = trade.Symbol,
                    Profit = trade.Result,
                    Action = trade.Action,
                    Quant = trade.ClosedQuant,
                    Entry = trade.EntryTime,
                    Exit = trade.ExitTime
                    };
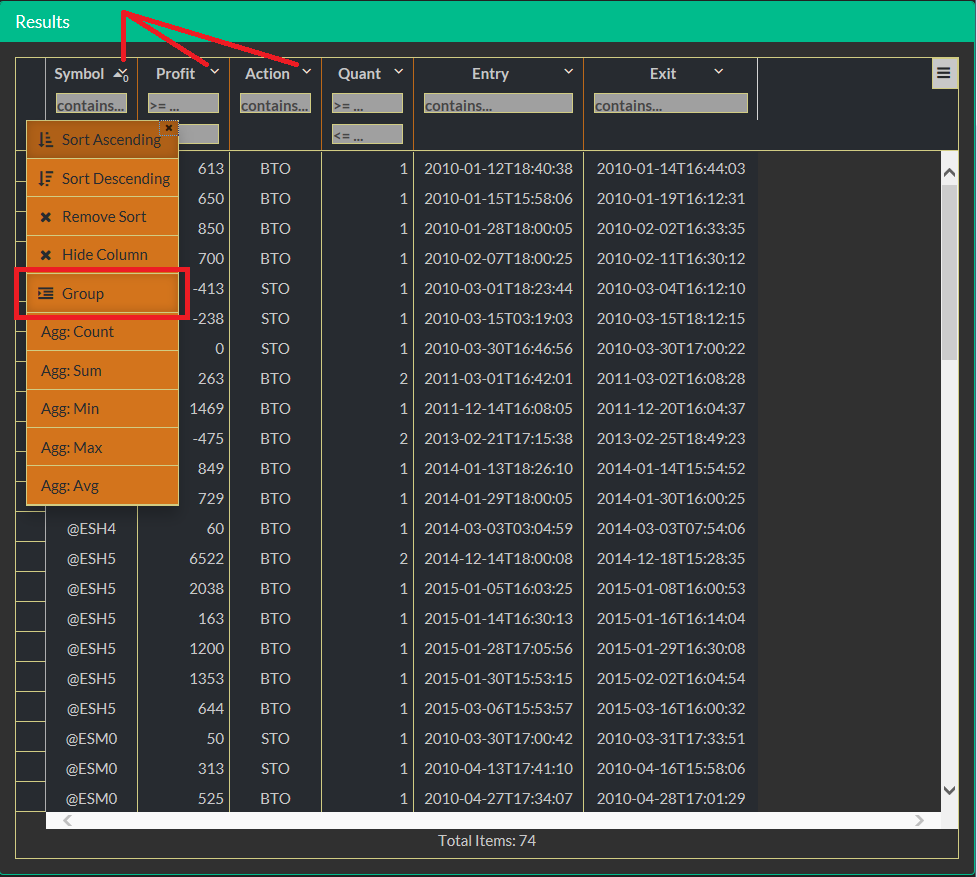
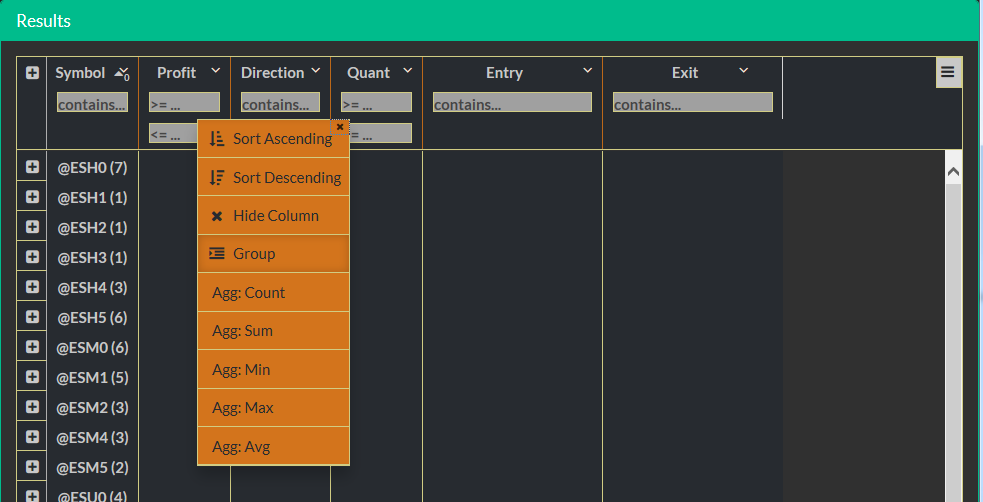
Columns have a drop-down icons for menus. Click on the drop down icon in the Symbol column. Select Group in the menu:
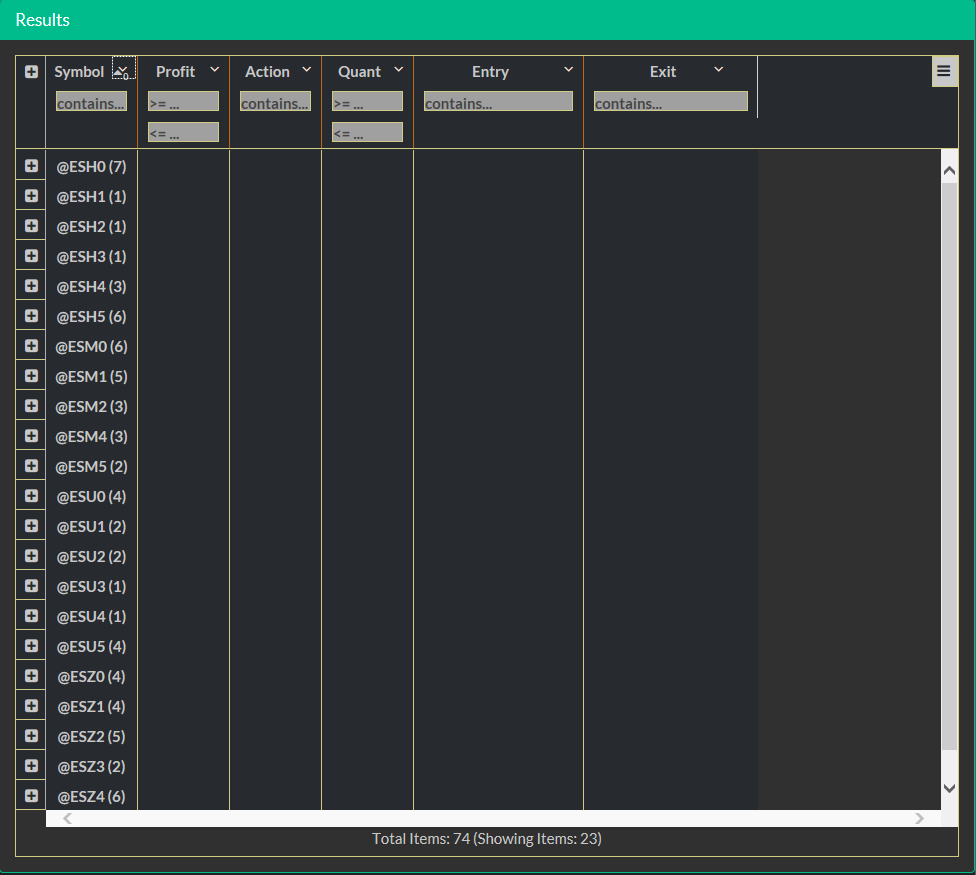
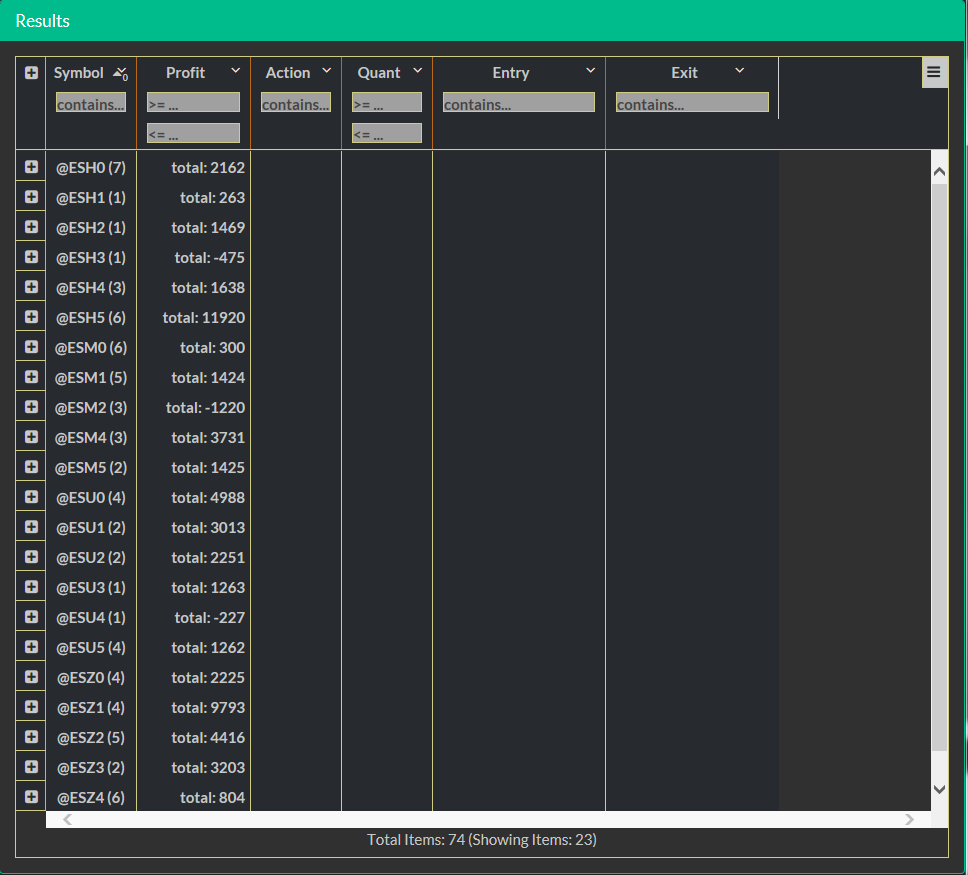
Rows are grouped by symbols now. You can see how many rows are in each group:
Click on the drop down icon in the Profit column. Select Sum in the menu:
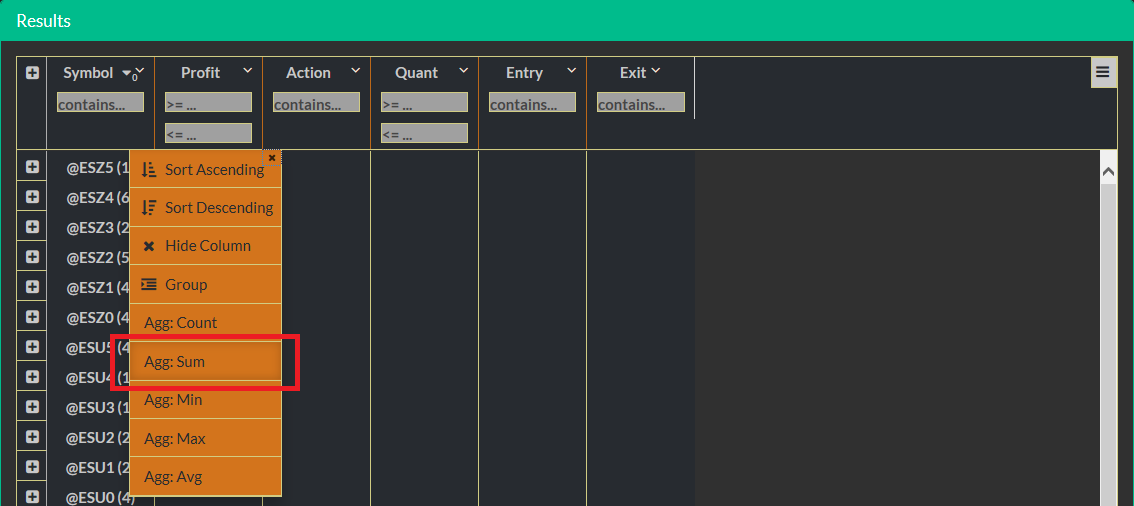
Voilà! We have sums of trades profits for each symbol:
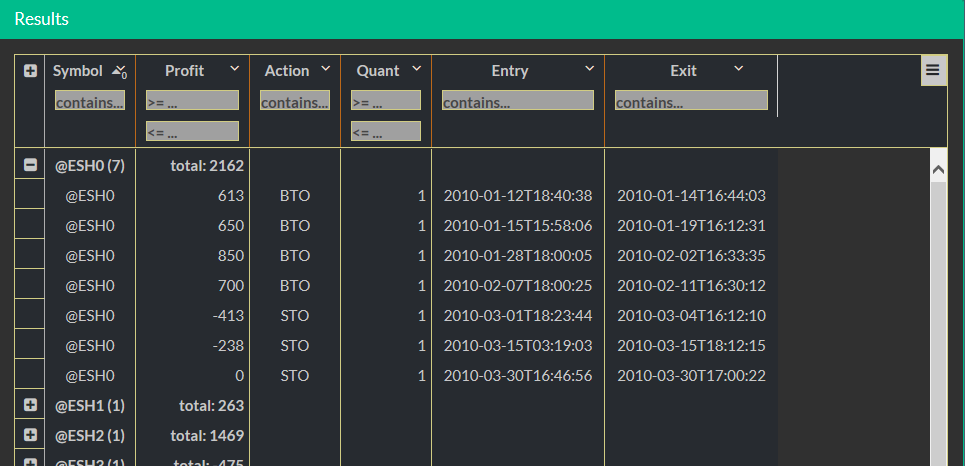
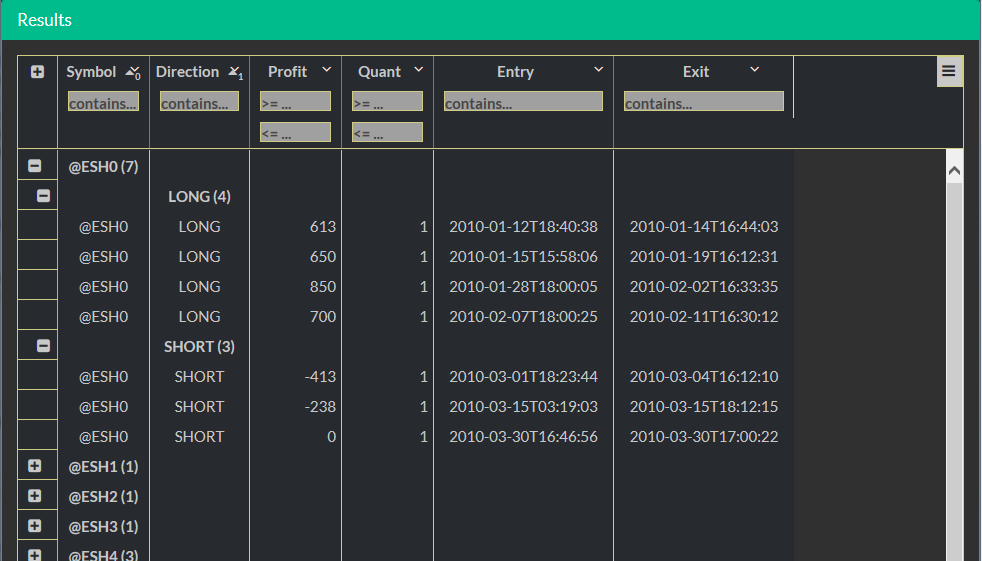
Interested in details? No problem. Click the plus icon on the left:
Perhaps you want to see trading results grouped by symbols and separated by the trading direction (LONG/SHORT positions).
Run following code.
TABLE = from trade in C2TRADES
        where trade.SystemId == 46106678
          select new {Symbol = trade.Symbol,
            Profit = trade.Result,
            Direction = trade.Action == "BTO" ? "LONG" : "SHORT", // Make a direction clearer
            Quant = trade.ClosedQuant,
            Entry = trade.EntryTime,
            Exit = trade.ExitTime
            };
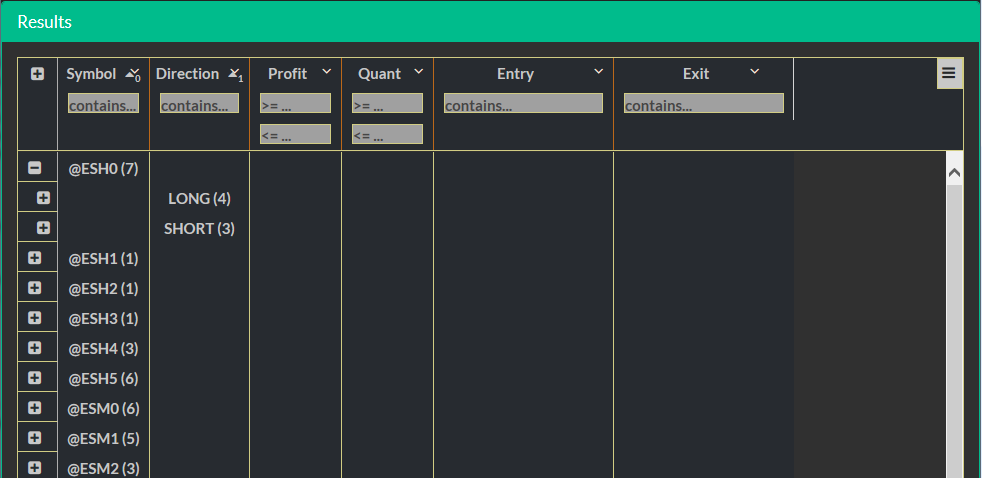
Click on the drop down icon in the Symbol column and select Group in the menu. The same in the Direction column:
Rows are grouped by symbols and directions:
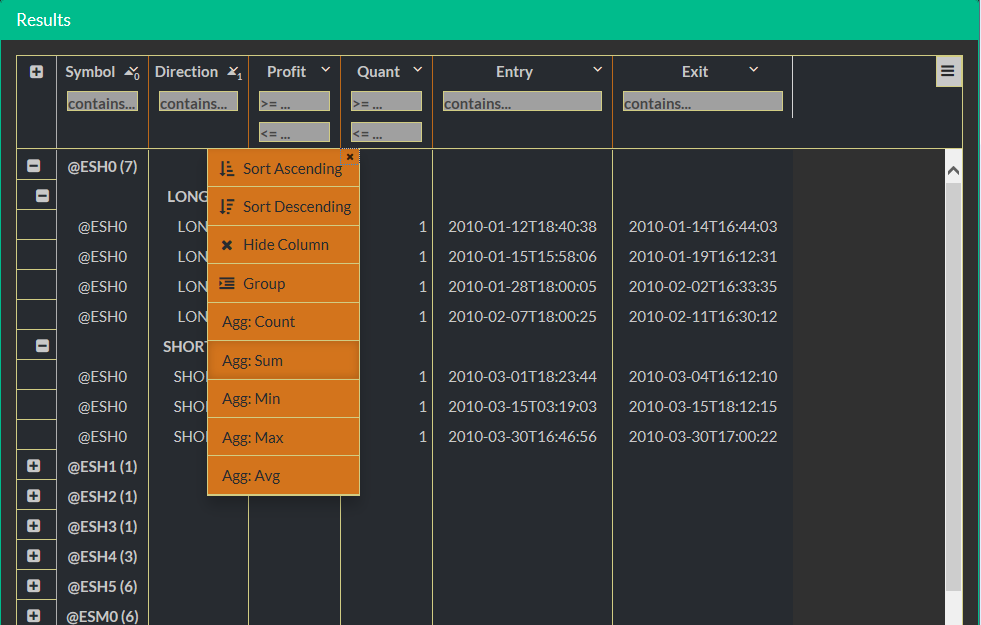
Click on the drop down icon in the Profit column. Select Sum in the menu:
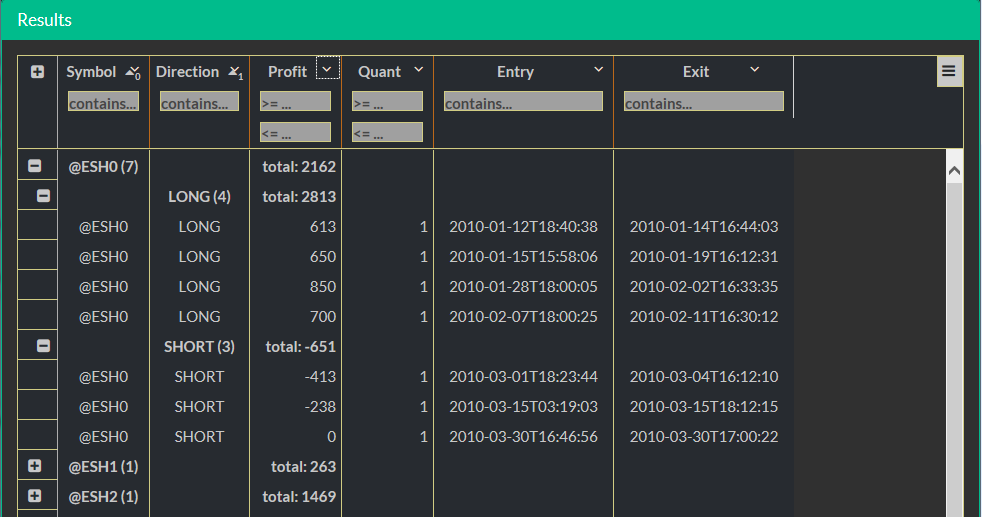
Done! We have sums of trades profits for each symbol and trading direction:
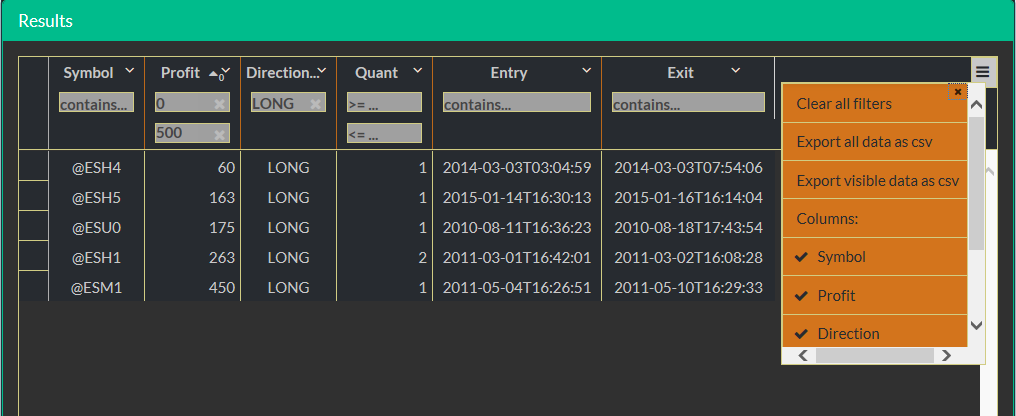
There is a menu at the top-right grid corner. Use it to download data in the CSV format.