| Column Chart |
This topic contains the following sections:
ColumnChart function creates a column chart from supplied data.
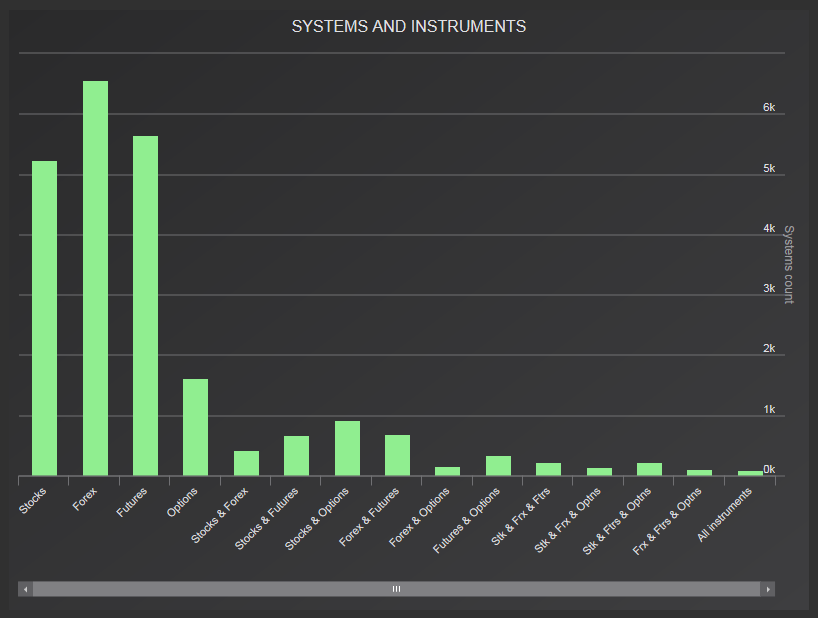
Create a column graph which shows numbers of Collective2 trading systems trading different sets of instruments.
Column chart
// Show numbers of systems trading a different sets of instruments.

var stocks = (from trade in C2TRADES where trade.Instrument == "stock" select trade.SystemId).Distinct();
var forex = (from trade in C2TRADES where trade.Instrument == "forex" select trade.SystemId).Distinct();
var futures = (from trade in C2TRADES where trade.Instrument == "future" select trade.SystemId).Distinct();
var options = (from trade in C2TRADES where trade.Instrument == "option" select trade.SystemId).Distinct();

IColumnChart chart = new ColumnChart("Systems and instruments", "Instruments", "Systems count");

chart.Add("Stocks", stocks.Count());
chart.Add("Forex", forex.Count());
chart.Add("Futures", futures.Count());
chart.Add("Options", options.Count());
chart.Add("Stocks & Forex", stocks.Intersect(forex).Count());
chart.Add("Stocks & Futures", stocks.Intersect(futures).Count());
chart.Add("Stocks & Options", stocks.Intersect(options).Count());
chart.Add("Forex & Futures", forex.Intersect(futures).Count());
chart.Add("Forex & Options", forex.Intersect(options).Count());
chart.Add("Futures & Options", futures.Intersect(options).Count());
chart.Add("Stk & Frx & Ftrs", stocks.Intersect(forex).Intersect(futures).Count());
chart.Add("Stk & Frx & Optns", stocks.Intersect(forex).Intersect(options).Count());
chart.Add("Stk & Ftrs & Optns", stocks.Intersect(futures).Intersect(options).Count());
chart.Add("Frx & Ftrs & Optns", forex.Intersect(futures).Intersect(options).Count());
chart.Add("All instruments", stocks.Intersect(forex).Intersect(futures).Intersect(options).Count());

CHART = chart;

/*
// A different way:

String[] categoriesNames = new String[15] { "Stocks", "Forex", "Futures", "Options",
                                            "Stocks & Forex", "Stocks & Futures", "Stocks & Options",
                                            "Forex & Futures", "Forex & Options", "Futures & Options",
                                            "Stk & Frx & Ftrs", "Stk & Frx & Optns", "Stk & Ftrs & Optns", "Frx & Ftrs & Optns",
                                            "All instruments" };
Decimal[] data = new Decimal[15] {
                stocks.Count(),
                forex.Count(),
                futures.Count(),
                options.Count(),
                stocks.Intersect(forex).Count(),
                stocks.Intersect(futures).Count(),
                stocks.Intersect(options).Count(),
                forex.Intersect(futures).Count(),
                forex.Intersect(options).Count(),
                futures.Intersect(options).Count(),
                stocks.Intersect(forex).Intersect(futures).Count(),
                stocks.Intersect(forex).Intersect(options).Count(),
                stocks.Intersect(futures).Intersect(options).Count(),
                forex.Intersect(futures).Intersect(options).Count(),
                stocks.Intersect(forex).Intersect(futures).Intersect(options).Count()
            };

CHART = ColumnChart("Systems and instruments", "Instruments", "Systems count", categoriesNames, data);*/
Result
Perhaps - you want to know if there is any pattern in developer's trading.
How about trades per days of week?
Trades per DOW
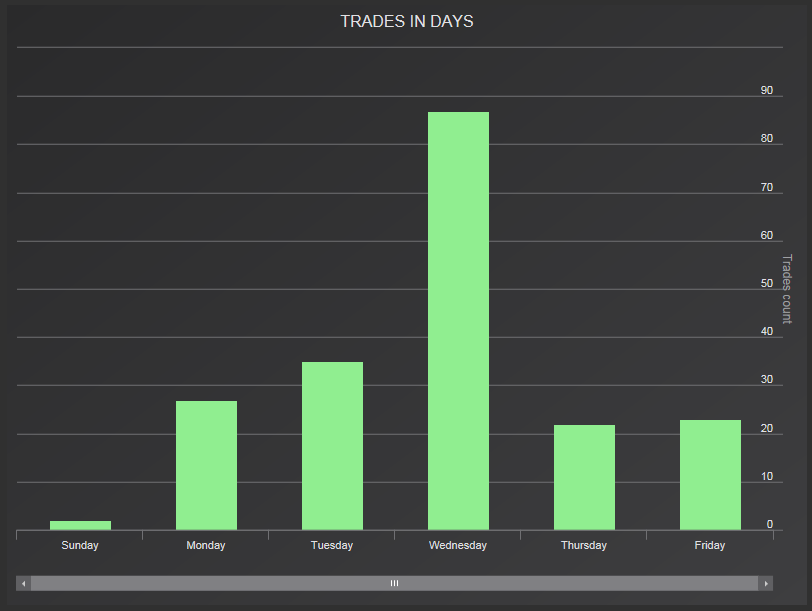
Well, it seems he/she likes to trade on Wednesday... Interesting...
How about profits?
Profits per DOW
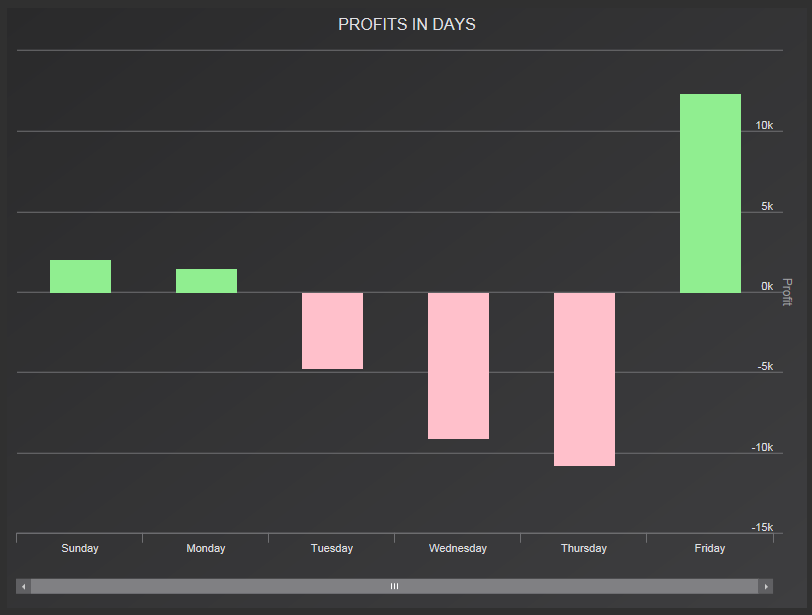
It seems that the best way to follow this trading system is to trade it only on Fridays. :-)
Column chart
// Counts of trades started in different weekdays

Int64 tradingSystemId = ENTER_SOME_TRADING_SYSTEM_ID_HERE;

var daysResults = from trade in C2TRADES
                  where trade.SystemId == tradingSystemId
                  group trade by trade.EntryTime.DayOfWeek into dow
                  select new
                  {
                      Day = dow.Key,
                      Count = dow.Count()
                  };

IColumnChart tradesChart = new ColumnChart("Trades in days", "Day", "Trades count");

foreach (var dayResult in daysResults)
{
    tradesChart.Add(dayResult.Day, dayResult.Count);
}

CHART = tradesChart;

HR();

// Profit of trades started in different weekdays

var daysProfits = from trade in C2TRADES
                  where trade.SystemId == tradingSystemId
                  group trade by trade.EntryTime.DayOfWeek into dow
                  select new
                  {
                      Day = dow.Key,
                      Profit = dow.Sum(t => t.Result)
                  };

IColumnChart profitsChart = new ColumnChart("Profits in days", "Day", "Profit");

foreach (var dayResult in daysProfits)
{
    profitsChart.Add(dayResult.Day, dayResult.Profit);
}

CHART = profitsChart;