| Scatter Chart |
This topic contains the following sections:
The ScatterChart class creates scatter charts from provided data. There are several variants of the functions. See the ScatterChart class for details.
Create a scatter chart of counts of C2 trading systems grouped by subscriptions fees.
Column chart
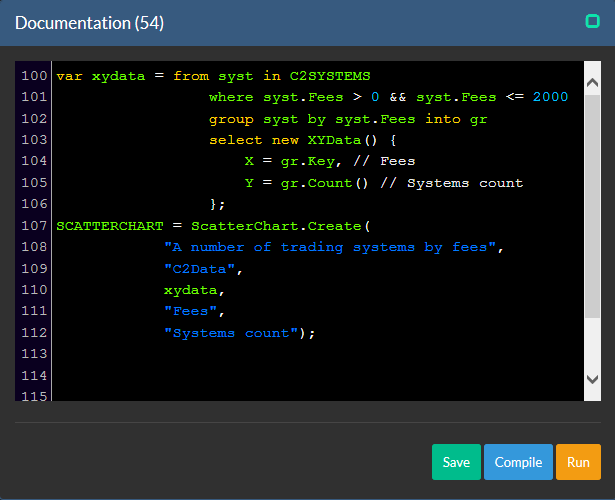
// Show numbers of systems by subscription fees

var xydata = from syst in C2SYSTEMS
             where syst.MonthlyFee > 0 && syst.MonthlyFee <= 2000
             group syst by syst.MonthlyFee into gr
             select new XYData()
             {
                 X = gr.Key, // Fees
                 Y = gr.Count() // Systems count
             };

CHART = ScatterChart.Create(
    "A number of trading systems by fees",
    "C2Data",
    xydata,
    "Fees",
    "Systems count");
HR();
TEXT = "Here are [X;Y] data:";
TABLE = xydata;
Code
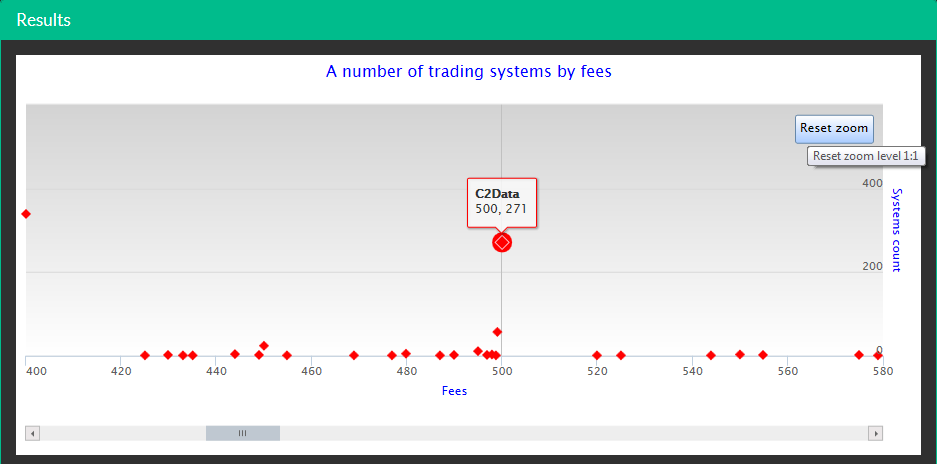
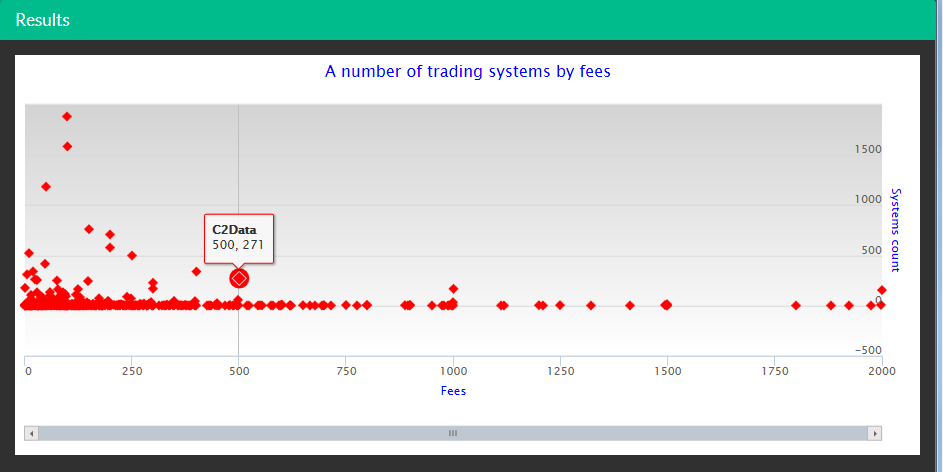
Result
Zoom