| Boxplot |
A boxplot chart. Box plots are useful for identifying outliers and for comparing distributions.
This topic contains the following sections:
Compare distributions of trades results of selected trading strategies.
Timeseries chart
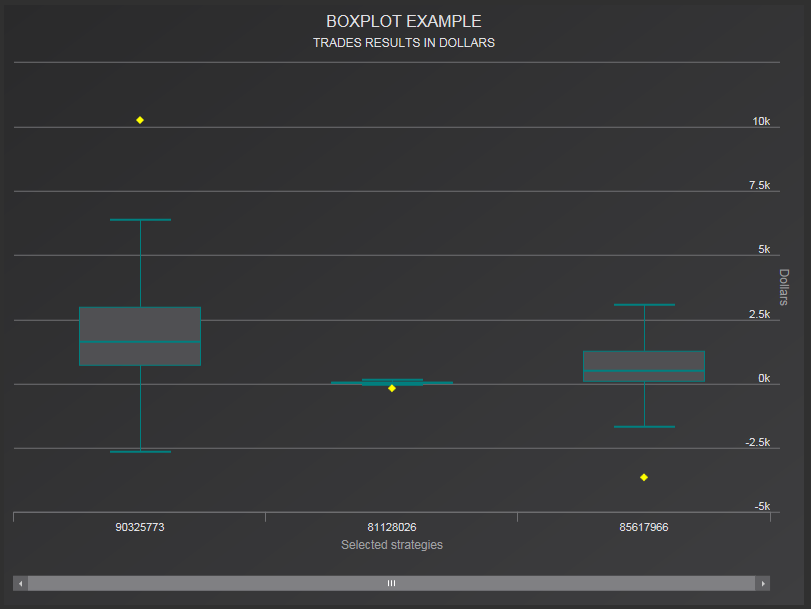
// Systems we want to see in the chart
// 90325773 ASCENDANT TY
// 81128026 Carma Stocks
// 85617966 Mozart

int[] systemsIds = { 90325773, 81128026, 85617966 };

// Create a chart object
IBoxplotChart boxplot = new BoxplotChart();
boxplot.Name = "Boxplot example";
boxplot.CategoriesSeriesName = "Selected strategies";
boxplot.DataSeriesName = "Dollars";
boxplot.SubtitleText = "Trades results in dollars";

// Add results data to the chart
foreach (var id in systemsIds)
{
    var results = from trade in C2TRADES
                  where trade.SystemId == id
                  select (Double)trade.Result;

    boxplot.Add(id, results);
}

CHART = boxplot;
Result