| Timeline Chart |
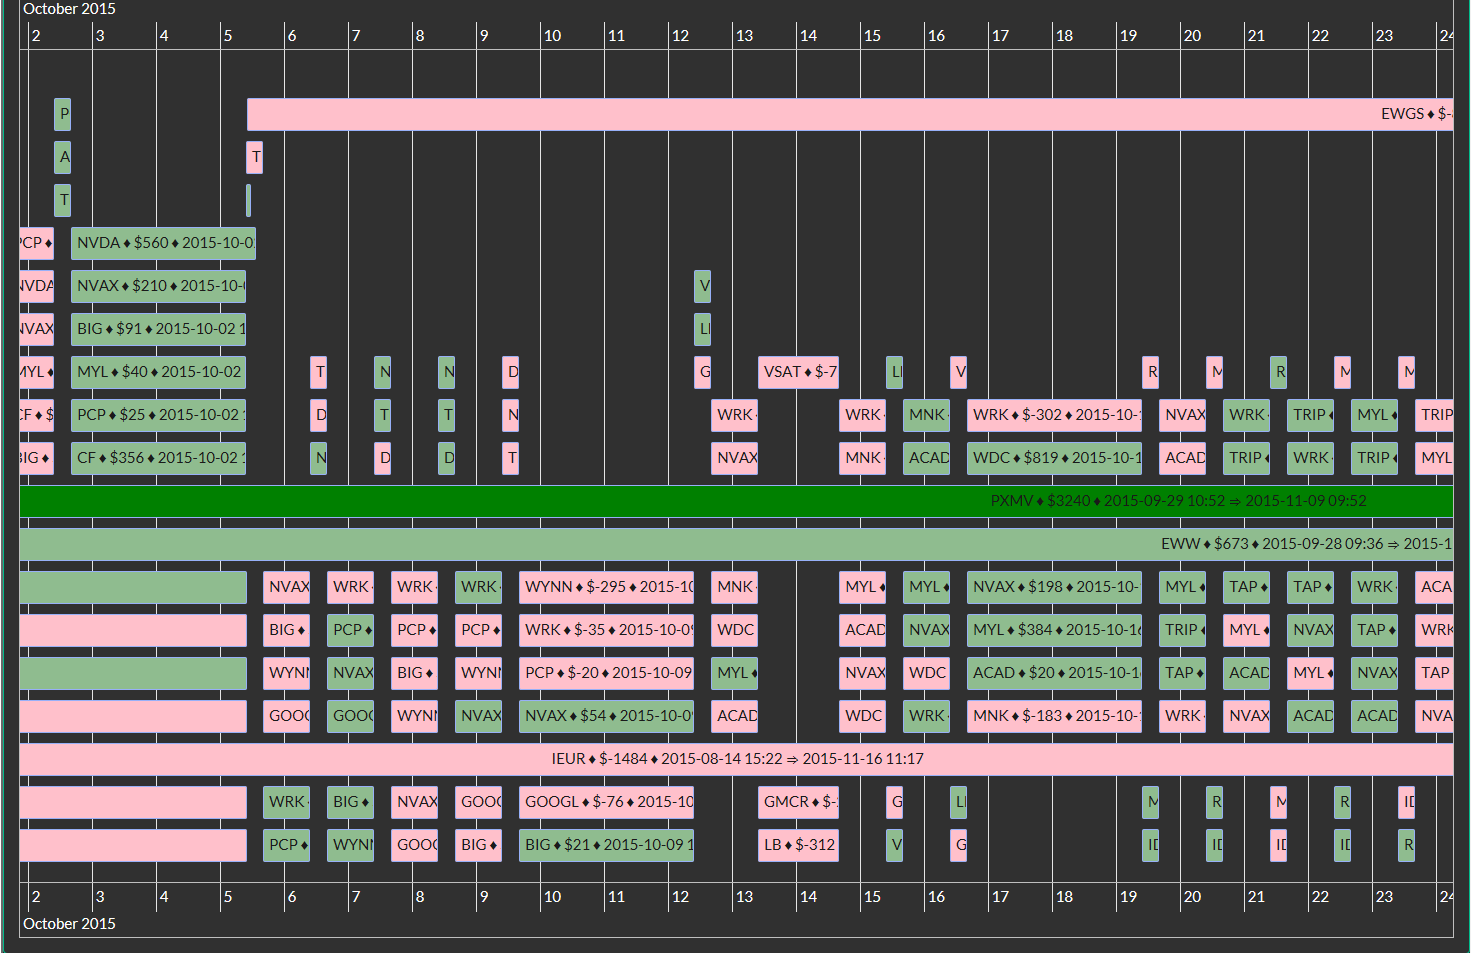
Timeline chart visualizes trades.
This topic contains the following sections:
// Show trades timeline

C2TIMELINE = GetC2SYSTEM(TRADING_SYSTEM_ID_HERE).TradesTimeLine(groups: TimeLineGroups.NoGroups);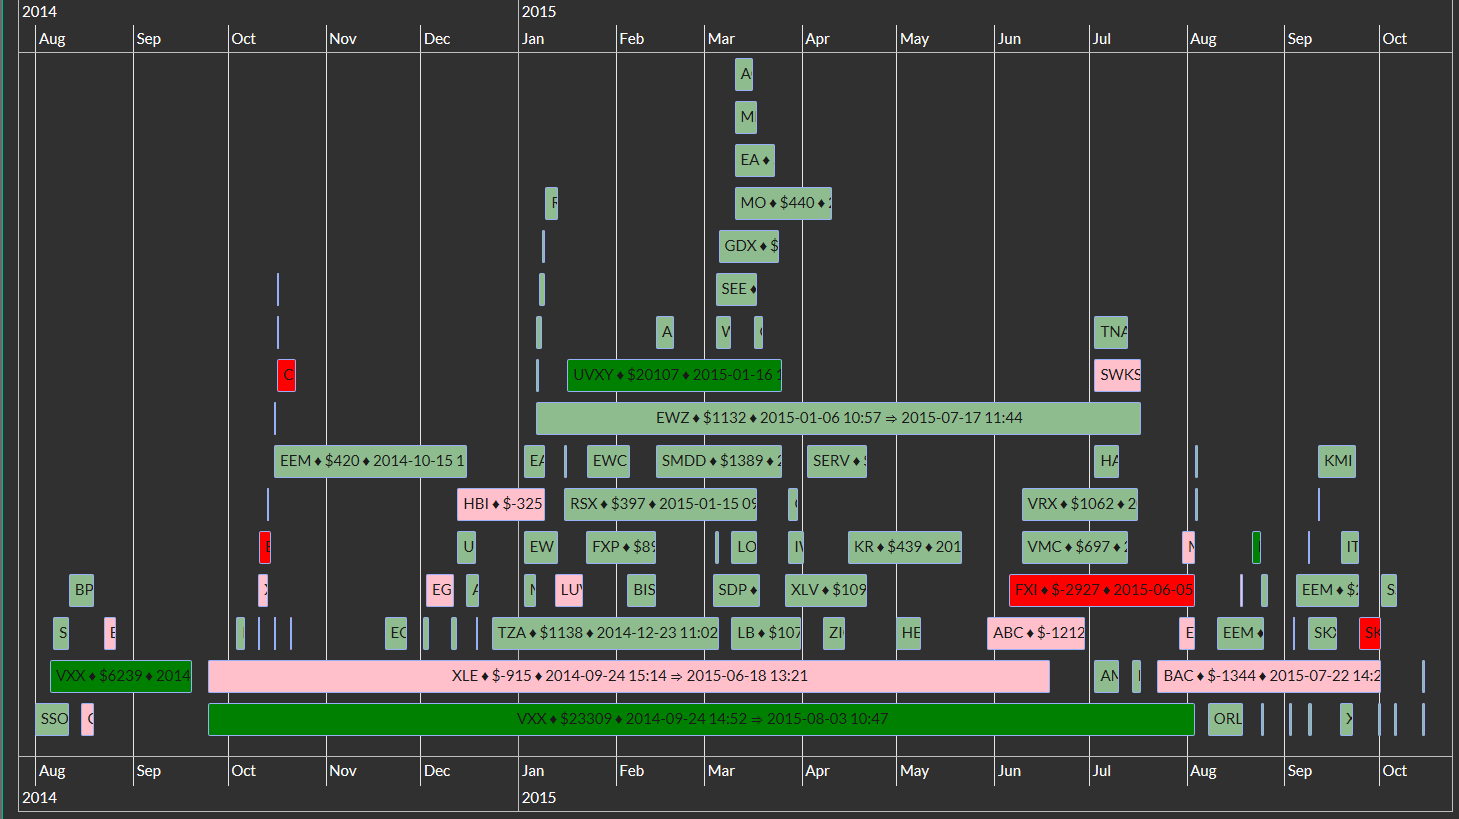
Chart can be dragged by mouse and zoomed (by mouse wheel):
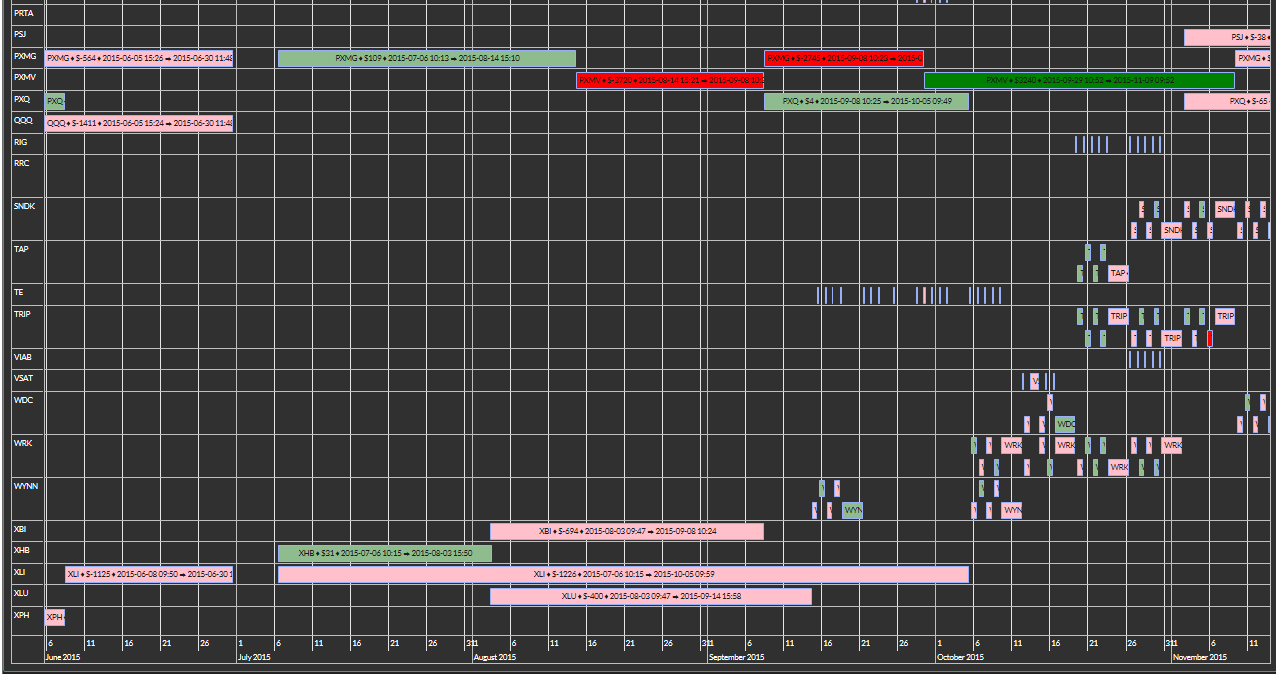
Timeline chart can show interesting findings sometimes.
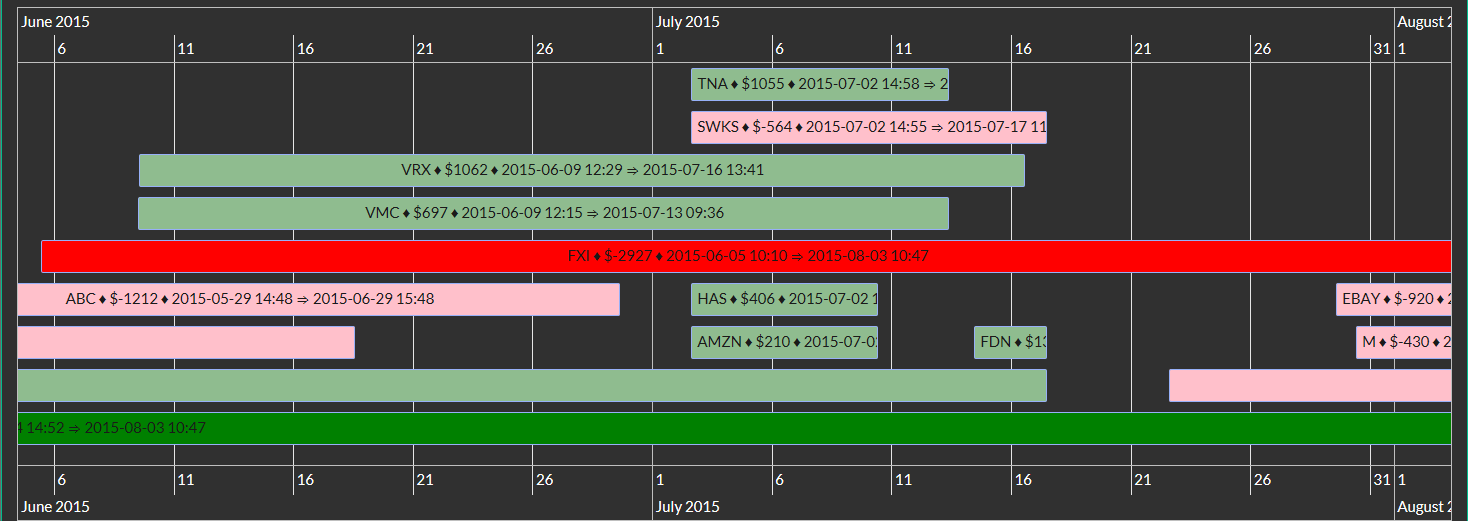
See next pictures of another strategy. You can see that a developer closed all positions on 2015-06-30 (and probably went on holiday :-) ).
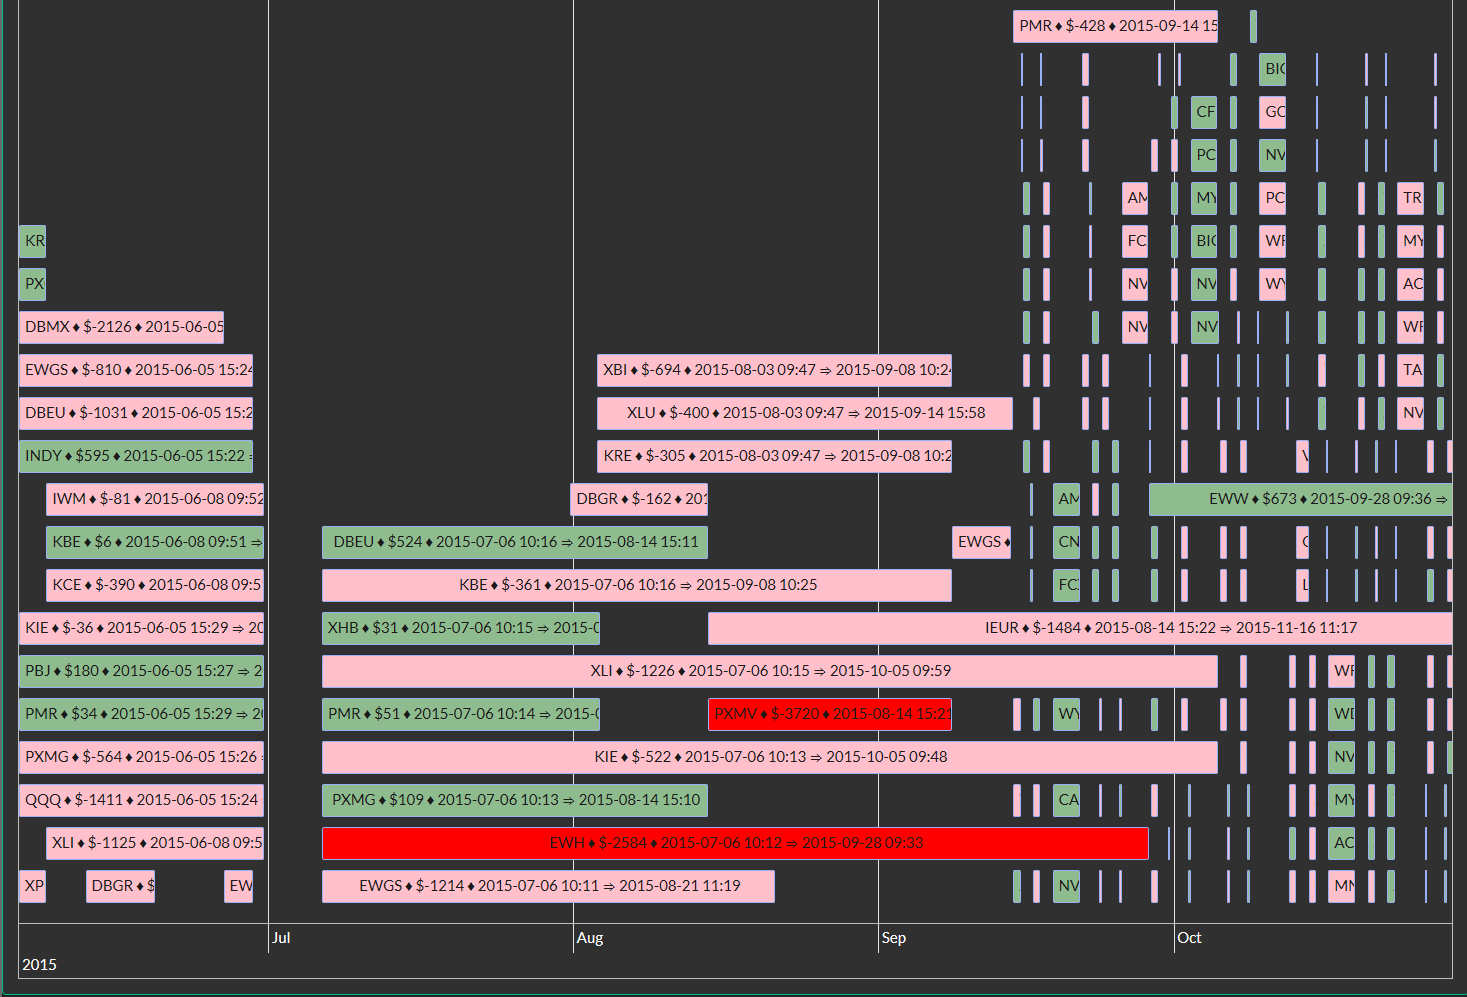
You can also see that he/she totally changed the strategy on 2015-09-15:
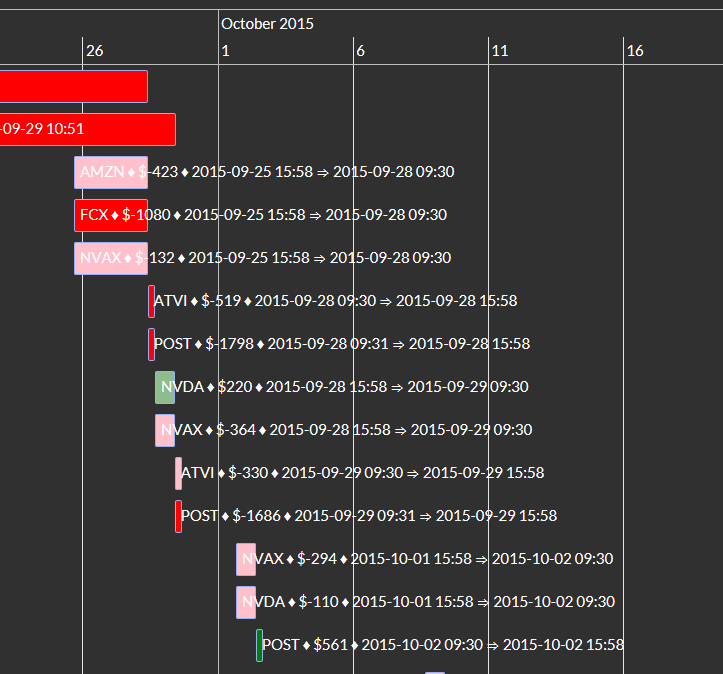
Zoomed chart shows interesting pattern of intra-day and overnight positions interrupted by positions held for 3 days:
The timeline chart tries (by default) to separate trades by their results to four groups: Big winners, Winners, Losers, Big losers.
Each group has its own band in the timeline chart.
A method used for that is Interquartile range.
A default separation of trades can changed by the parameter k
described in the Interquartile range and outliers
section.
If you have too many "Big" trades, try a higher k
value.
// Show trades timeline

C2TIMELINE = GetC2SYSTEM(TRADING_SYSTEM_ID_HERE).TradesTimeLine(groups: TimeLineGroups.NoGroups);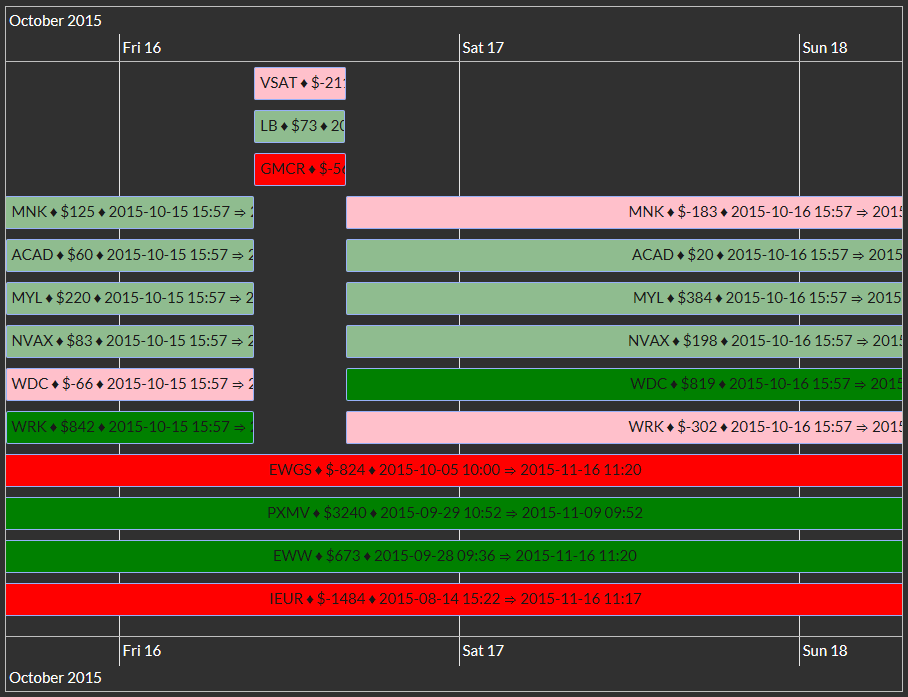
// Show trades timeline

C2TIMELINE = GetC2SYSTEM(TRADING_SYSTEM_ID_HERE).TradesTimeLine();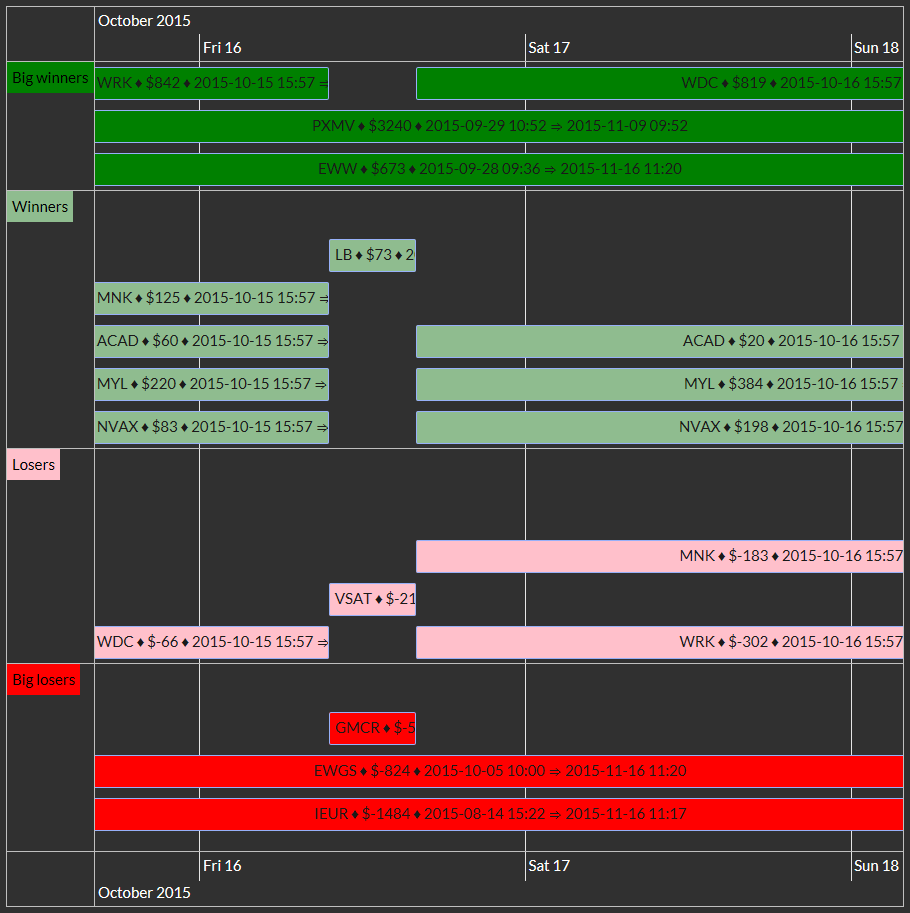
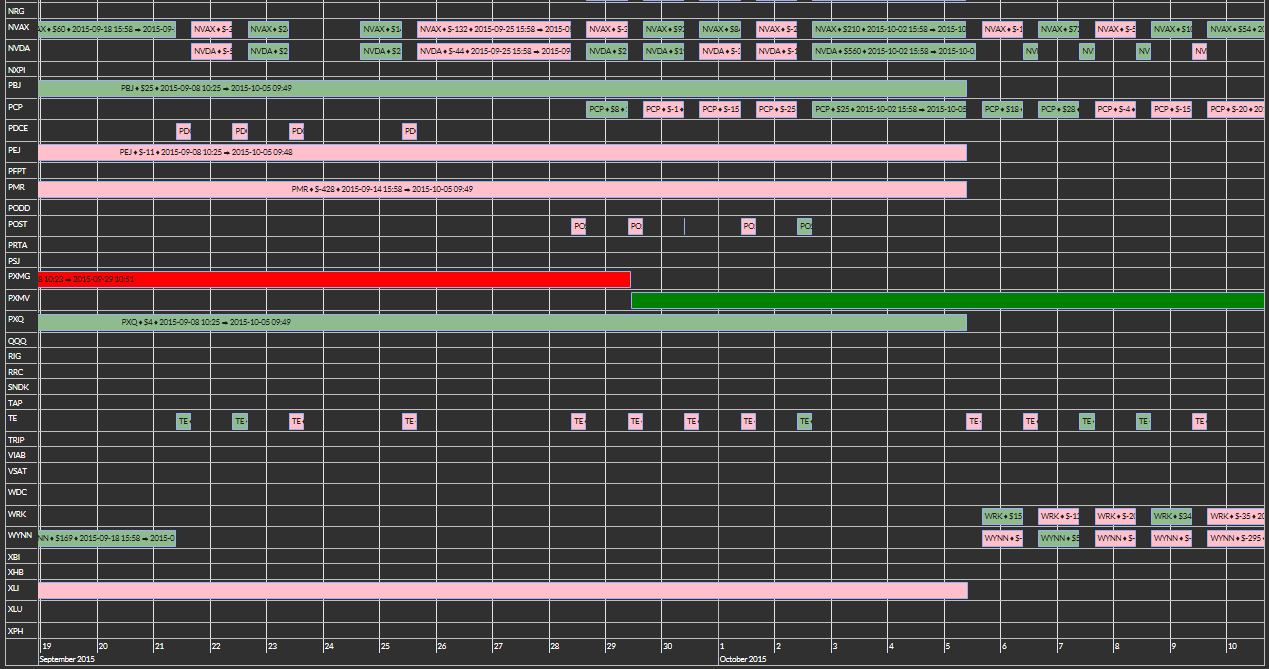
This is another grouping. Each symbol has its own band in the timeline chart.
// Show trades timeline

C2TIMELINE = GetC2SYSTEM(TRADING_SYSTEM_ID_HERE).TradesTimeLine(groups: TimeLineGroups.Symbols, k: 10);
Many times the bars in the chart are too short and one need to zoom to see their descriptions.
There is a parameter useOverflow
there.
It modifies the chart so that texts overflow bars. It is not ideal, but it can help sometimes.